Every crypto price comparison starts with the same rookie mistake: opening one exchange, reading one number, and calling it “the market”. It isn’t. Bitcoin trades on hundreds of venues simultaneously — centralised exchanges, decentralised pools, OTC desks, P2P boards — and at any given second those venues disagree with each other. Usually by fractions of a percent; occasionally, during a liquidation cascade or a banking-rails outage, by whole percentage points. When someone quotes you “the price of Bitcoin”, the only honest response is a question: on which venue, in which currency pair, measured how?
This guide is the comparison-desk version of that question. We cover how aggregators like CryptoCompare, CoinGecko and CoinMarketCap turn hundreds of disagreeing venues into one composite number, why the number you can actually trade at is always worse than the number on the screen, and the specific ways stale or manipulated prices separate people from their money. Everything here is written from the perspective we always take on this site: independent, unaffiliated, and allergic to marketing. Where we cite exact methodology details about CryptoCompare products, they come from the official cryptocompare.com; everything else is standard market microstructure that has been true since long before crypto existed.
The live market, right now
Before the theory, the practice. The table below loads the top coins by market capitalisation directly in your browser from the public CoinGecko API — an aggregate view, exactly the kind of composite number this whole page is about. Treat it as a reference point, not an execution quote; by the end of this guide you will know precisely why those are different things. For the ranking side of this table — what market cap actually measures and how it gets gamed — see our market cap explainer.
| № | Coin | Price | 24h % | Market Cap | Volume 24h |
|---|---|---|---|---|---|
| 1 | Bitcoin (BTC) | — | — | — | — |
| 2 | Ethereum (ETH) | — | — | — | — |
| 3 | Solana (SOL) | — | — | — | — |
| Live data loads here from the CoinGecko API — refresh if you see this message. | |||||
Why “the price of Bitcoin” doesn’t exist
A share of Apple has one primary listing, one closing auction, one official closing price. Bitcoin has none of that. There is no primary exchange, no closing bell, no consolidated tape mandated by a regulator. Each venue runs its own order book, with its own participants, its own fiat rails and its own frictions. Binance’s BTC/USDT book, Coinbase’s BTC/USD book and Kraken’s BTC/EUR book are three separate markets that happen to trade claims on the same asset. Arbitrageurs keep them roughly aligned — when the gap exceeds the cost of closing it, someone closes it and pockets the difference — but “roughly aligned” is doing a lot of work in that sentence. The alignment is only as tight as the frictions are small, and crypto frictions (withdrawal delays, transfer fees, banking hours, KYC queues) are anything but small.
So when a headline says “Bitcoin hits $100,000”, what actually happened is that some venue printed a trade at $100,000, or an aggregator’s composite crossed that line. Those are different events, and they can be minutes apart. Once you internalise this, a lot of confusing crypto experiences suddenly make sense: why your exchange showed a different number than the news, why your limit order didn’t fill at “the price”, and why two portfolio apps disagree about what your coins are worth.
How aggregators build a composite price
An aggregator’s job is to take dozens or hundreds of venue prices and compress them into one defensible number. The big three retail-facing aggregators do it in broadly similar ways with different filters:
- CryptoCompare computes its aggregate index by combining trade data across the exchanges it integrates, weighting venues by volume and applying penalties for stale or outlying data so that a dead market or a fat-fingered print can’t drag the composite around — that methodology, according to the official cryptocompare.com, underpins the aggregate prices you see across its coin pages, and its institutional descendants became FCA-regulated benchmark rates. The consumer site also publishes a “top tier volume” view that only counts exchanges passing quality checks.
- CoinGecko aggregates prices across the venues it tracks and weights them by liquidity-related factors, publishing a global volume-weighted average. Its “trust score” system was built in 2019 specifically because raw reported volume had become an arms race of fiction.
- CoinMarketCap uses a volume-weighted average across tracked market pairs, with outlier detection and its own confidence metrics — a system it tightened repeatedly after years of criticism that it uncritically republished wash-traded volume.
Note the shared skeleton: volume-weighted average with outlier filtering. The weighting means big liquid venues dominate the composite; the filtering means a tiny exchange printing nonsense doesn’t move it. This is also why composites from different aggregators rarely match to the cent — they track different venue sets, apply different weights and refresh on different schedules. If you plan to build on this data rather than just read it, our CryptoCompare API guide covers how to pull aggregate and per-exchange prices programmatically, including what the free tier will and won’t give you.
Last trade, mid-price, VWAP: three numbers, three jobs
Even on a single venue there is no single price — there are at least three, and confusing them costs money:
| Measure | What it is | Good for | Fails when |
|---|---|---|---|
| Last trade | The price of the most recent executed trade | Tickers, headlines, candles | Illiquid pairs — the “last trade” may be hours old or one dust-sized order |
| Mid-price | Halfway between best bid and best ask | Fair-value snapshots, spread maths | Wide books — the mid is a number nobody will actually trade with you at |
| VWAP | Volume-weighted average price over a window | Benchmarks, indices, “did I get a fair fill?” | Quiet periods — thin volume makes it easy to nudge |
Aggregator composites are essentially cross-exchange VWAPs. Your execution happens against a specific order book at a specific moment. The distance between those two — composite versus your actual fill — is the whole game, and it is made of two components: the spread and the depth.
Spreads, depth and slippage, explained on fingers
The spread is the gap between the highest price a buyer will pay (bid) and the lowest price a seller will accept (ask). On BTC/USD at a major exchange it is often a rounding error. On a small altcoin at a small exchange it can be several percent — an entry fee you pay before any market movement, in both directions.
Depth is how much you can trade before you run out of orders at the best price. A market order doesn’t execute at one price; it eats through the book, level by level, and your average fill drifts away from the quote. That drift is slippage.
Worked example: a £5,000 market buy on a thin book. Say a mid-cap token shows a last trade of £2.00, and the ask side of the book looks like this: 500 tokens offered at £2.00, 800 at £2.03, 900 at £2.07, and more at £2.12. Your £5,000 market order first takes the 500 tokens at £2.00 (£1,000 spent). Then all 800 at £2.03 (£1,624 more). Then roughly 1,148 tokens at £2.07 to exhaust the rest (~£2,376). Total: about 2,448 tokens for £5,000 — an average price of roughly £2.04, about 2.1% above the price on the screen. Add a 0.3% taker fee and you are ~2.4% underwater at the moment of purchase, before the market has moved an inch. Sell the same size into the same book and you pay a similar toll on the way out.
On a deep book — say BTC on a top-five exchange — the same £5,000 might slip by a few hundredths of a percent. Same order, same coin category, wildly different real cost. This is why our exchange comparison keeps banging on about liquidity rather than logo familiarity.
Auditor’s rule: the screen price is an advertisement; the order book is the contract. Never size a trade without looking at what the book can actually absorb.
Premiums and dislocations: when venues disagree on purpose
Sometimes price gaps between venues persist for months, because the friction keeping them open is structural rather than technical. The classic case is the Kimchi premium: through 2017–2018, Bitcoin on South Korean exchanges traded persistently above global prices — at the January 2018 peak the gap reached roughly 20%. The cause wasn’t Korean traders being bad at maths; it was capital controls. You couldn’t freely wire money out of Korea to buy cheap BTC abroad and sell it dear at home, so the gap sat there, visible to everyone and harvestable by almost no one. Smaller cousins of the same effect appear wherever money moves slower than information.
- Weekend gaps. Banks sleep; blockchains don’t. When fiat rails close on Friday evening, arbitrageurs can’t rebalance cash between venues, spreads widen, and crypto prices drift on thinner books. A surprising share of violent crypto moves historically clustered on weekends for exactly this reason.
- EUR and GBP pairs versus USD. Most crypto liquidity lives in USD and USDT pairs. BTC/GBP and BTC/EUR books are thinner, so they show wider spreads and small persistent offsets against the USD price converted at the FX rate. If you buy in pounds, part of your “crypto fee” is actually an FX-and-liquidity fee. Run the conversion both ways in our crypto calculator and compare against your venue’s GBP quote — the gap you find is real, recurring, and rarely disclosed.
- Stress dislocations. During exchange outages or banking freezes, a venue’s price can detach entirely from the market — the infamous moments when one exchange shows a 10% discount because its users can’t withdraw fiat and are paying a panic premium to escape into crypto. A price that only exists where your money is trapped is not a price; it is a symptom.
Stale prices: the scammer’s favourite data feed
Everything above assumes the number you see is at least current. On P2P boards and Telegram “exchangers”, it frequently isn’t — deliberately.
Price manipulation 101
Comparison also protects you from prices that are manufactured rather than merely stale. The two techniques worth knowing by name:
- Wash trading — an entity trading with itself to fabricate volume and, on thin books, to paint prices. For years, a large share of headline crypto volume was widely estimated to be wash-traded; a famous 2019 Bitwise analysis argued that most reported BTC volume at the time was fake. This is precisely why serious aggregators built quality filters: CryptoCompare’s top-tier volume view, CoinGecko’s trust scores, CoinMarketCap’s confidence metrics. A coin doing enormous volume on one obscure venue and a trickle everywhere else is not liquid; it is loud.
- Spoofing — placing large orders you intend to cancel, to fake supply or demand and herd other traders. The giant bid wall that vanishes the moment price approaches it was never going to buy anything; it was a billboard. Under
MiCA, EU-regulated venues now carry explicit market-abuse obligations, which raises the cost of these games on compliant exchanges — one genuinely useful side effect of the 2024–2026 regulatory wave — but offshore and DeFi venues remain a free-fire zone.
The defence is the same in both cases: never trust a price a single venue is showing you, especially for a small coin. Cross-check the composite, check where the volume actually lives, and check whether the aggregator’s quality filters agree with the raw number.
The arbitrage reality check
At this point a reasonable reader asks: if venues disagree, why not buy cheap on one and sell dear on the other? Honest answer: because by the time you can, the trade is usually gone or negative. Count the real costs: taker fees on both venues (say 0.1–0.4% each side), the withdrawal fee to move coins between them, the network fee, and — the killer — time. An on-chain transfer plus exchange processing can take from minutes to hours; deposit crediting can add more; fiat settlement adds days. A 0.5% gap that looked juicy evaporates or inverts while your coins are in transit, and you carry full price risk the entire way. Professional arbitrage desks solve this by pre-positioning inventory on both venues and netting internally, with fee tiers you will never see. Retail arbitrage, run honestly with 2026 fees and Travel Rule-era withdrawal checks, is a machine for converting your time into exchange revenue. If someone on social media is selling you an “arbitrage bot” with guaranteed returns, you have found the scam, not the arbitrage.
How to compare before buying: the four-step workflow
- Aggregate price first. Get the composite from an aggregator (this page’s widgets, cryptocompare.com, CoinGecko). This is your fair-value anchor — the number every other number must justify deviating from.
- Venue price second. Open the exchange where you would actually trade and compare its pair price to the anchor. A deviation beyond ~0.5% on a major coin needs an explanation: thin fiat pair, venue stress, or stale data.
- Depth third. Look at the order book (or the venue’s slippage estimate) at your trade size. Estimate slippage the way we did in the £5,000 example above. If the book can’t absorb your size within your tolerance, split the order or use limits.
- Total cost last. Add the taker/maker fee, any deposit fee, and the eventual withdrawal fee — then compare the all-in cost across your shortlisted venues. The cheapest screen price loses to the cheapest total cost surprisingly often; our exchange comparison guide walks through the fee lines venues prefer to whisper.
Alerts and monitoring: compare continuously, not once
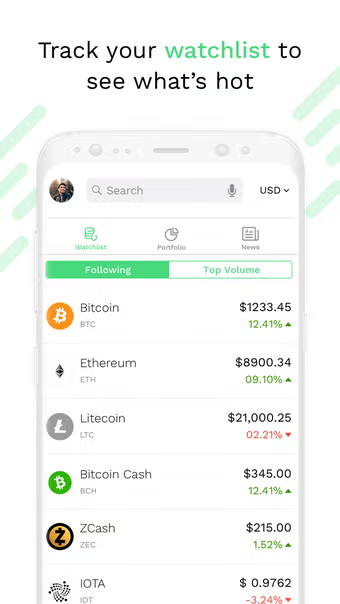
Price comparison isn’t a one-off ritual before a purchase; markets move around the clock, and the venue that was cheapest on Tuesday isn’t guaranteed to be cheapest on Friday. The pragmatic setup: a watchlist on an aggregator for the composite view, plus price alerts so you check the book only when something actually happens. The CryptoCompare mobile app supports customisable price alerts and watchlists — according to the official cryptocompare.com — and pairing those alerts with the per-exchange markets view gives you both the anchor and the venue detail in one place; we cover setup, platforms and the app’s honest limitations in our app guide. Whatever tool you pick, alert on the composite, execute on the venue, and re-run the four-step workflow at the moment of the trade — not from memory.
One last piece of comparison-desk hygiene: once a purchase is done, the price question is replaced by the custody question. Coins you plan to hold do not belong on the venue where you bought them — an exchange is a bank holding your keys, and this page is full of reasons venues fail in creative ways. For anything beyond an actively-traded balance, move to self-custody and treat the seed phrase like the bearer instrument it is; our wallet comparison covers the hardware options that make that step boring, which is exactly what it should be.
Frequently asked questions
Why do crypto prices differ between exchanges?
Because each exchange is a separate market with its own order book, participants and fiat rails. Arbitrage keeps prices roughly aligned, but fees, withdrawal delays, banking hours and capital controls limit how tightly. Small persistent gaps are normal; large ones signal thin liquidity, venue stress or trapped funds.
Which crypto price is “correct” — CryptoCompare, CoinGecko or CoinMarketCap?
None of them, and all of them. Each publishes a volume-weighted composite over a different set of venues with different outlier filters, so they rarely match to the cent. For a fair-value anchor any major aggregator is fine; for execution, only the order book of the venue you trade on matters.
What is slippage and how do I estimate it before trading?
Slippage is the gap between the quoted price and your actual average fill, caused by your order eating through the book. Estimate it by reading the order book at your trade size: sum the levels your order would consume and compare the average to the best quote. On thin books a mid-sized market order can slip several percent; limit orders cap it at the cost of possibly not filling.
Is crypto arbitrage between exchanges still profitable for retail traders?
Almost never, honestly. After taker fees on both sides, withdrawal and network fees, and the price risk carried during transfer delays, typical retail arbitrage is negative. Professional desks pre-position inventory on multiple venues and pay fee tiers retail cannot access. Treat any “guaranteed arbitrage bot” pitch as a scam by default.
What was the Kimchi premium?
A persistent markup of Bitcoin prices on South Korean exchanges versus global markets, peaking around 20% in January 2018. Korean capital controls prevented arbitrageurs from freely moving fiat to close the gap, so it persisted in plain sight. It remains the textbook example of how money friction, not information, keeps venue prices apart.
How do I avoid stale-price scams on P2P and Telegram exchangers?
Pull the live composite yourself — from an aggregator or this site’s widgets — at the moment of settlement, not when the deal was agreed, and insist on repricing against it. Refuse quotes that are minutes old, and remember that off-exchange trades have no escrow, no chargeback and no support desk: once coins leave your wallet, they are gone.